Slow
A close look at a bridge often means scheduling crews, equipment, and traffic control weeks ahead, so new condition information arrives slowly between inspections.


Drone bridge condition surveys and records
A fixed mark for every bridge.
VardeSurvey™ bridge condition surveys are a surveying and engineering-support service for bridge owners and DOTs. We use drones to photograph and measure your bridges, then turn each flight into a dated, stitched image record your inspectors can compare from one visit to the next. Survey flights are planned to keep their own time on the bridge and lane closures to a minimum. A clear picture over time.
VardeSurvey condition surveys support engineer-led inspection. A survey is not an inspection and does not take the place of one.
Why "Varde"? In Norway, a varde is a cairn: a stack of stones that marks the way and fixes a point on the land. Surveyors have long used them as reference marks. Our work follows the same idea. Each flight sets a fixed, dated marker of a bridge's condition, so the next inspection has something solid to measure against.
The problem
A close look at a bridge often means scheduling crews, equipment, and traffic control weeks ahead, so new condition information arrives slowly between inspections.
Every hands-on look means snooper trucks, lifts, or rope access, often next to live traffic. Engineers need to know where that effort, and any testing, matters most.
Inspections happen on a set schedule, so the record is a series of separate snapshots. Notes and photos vary by inspector, which makes it hard to see how a crack or defect has changed between visits.
What engineers and owners need: a current, consistent record of each bridge's condition between inspections, tracked over time, so engineers can see how it is degrading and where a closer look or testing is needed.
Our approach
A drone flies a planned path around the deck, beams, piers, and bearings, taking overlapping, high-resolution photos. Flights are planned to keep their own time on the bridge and lane closures to a minimum.
After the flight, the photos come back to our office processing servers. There we check every image, log the time and location of each frame, and stitch them into a single, measurable picture of the bridge, called an orthomosaic. The finished record is then delivered securely to the cloud, where your team can view it from any office.
In a follow-on phase, AI tools will scan the stitched images and flag likely cracks for an inspector to review. People make the call; the AI flags point them to where to look, helping DOTs and agencies see where testing is needed.
Every flight becomes a dated marker. Over time, owners and their engineers get a history of each bridge that shows what changed, where, and when.
Field app
Our survey crews use an Android field app to check the aircraft before a flight and turn each bridge survey into a checked flight plan that can be flown the same way on the next visit. It is a tool we use to deliver your survey, not a product we sell.
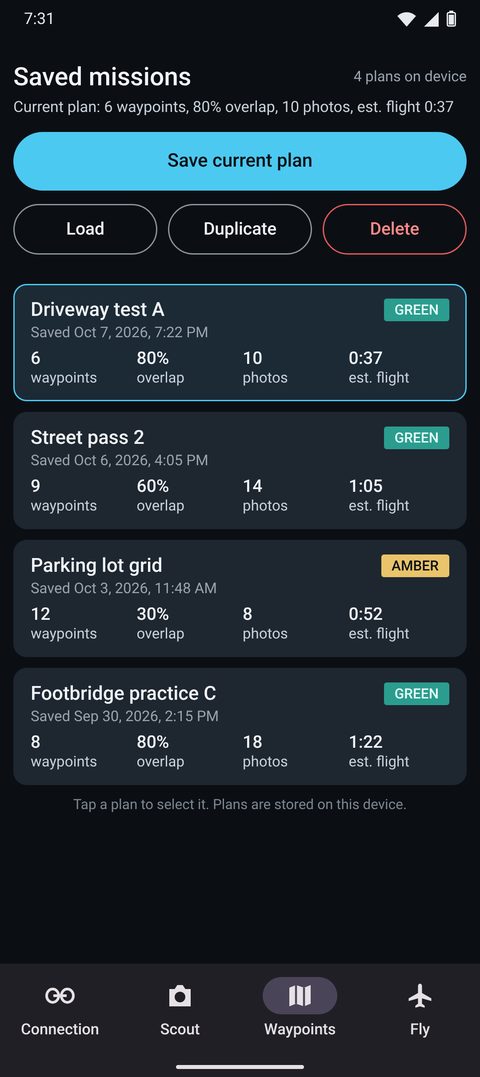
This screen is SIMULATED. The saved missions screen is a mockup with sample plans; saved missions are still in development.
Pipeline
The drone flies the checked plan and takes overlapping, high-resolution photos.
Photos are copied off the aircraft and checked so nothing is missed.
Our office processing servers combine the photos into one measurable image of the bridge.
AI tools will flag likely cracks for an inspector to review.
The finished record is delivered securely to the cloud for your team to view.
Your records stay yours. We store them securely, and your team has full access at any time.
Contact
Tell us about your bridges and what you need to track between inspections. We will follow up to talk through a pilot.
Email: vardesurvey@jcibox.com
Phone: 484.437.0546